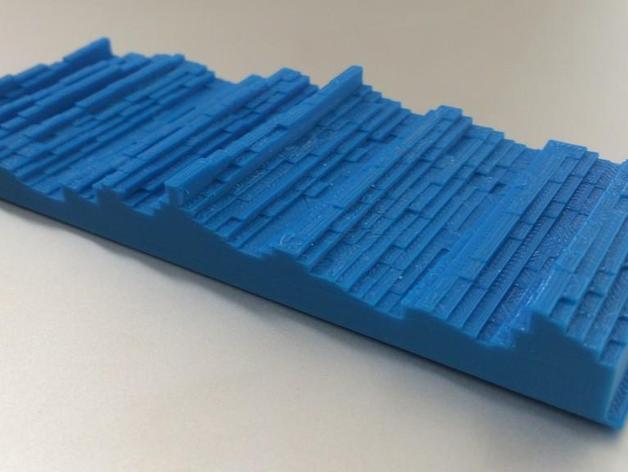
U.S. Unemployment Rate 1948-2015 (monthly)
thingiverse
Here is a quick chart I put together by leveraging U.S. unemployment rate data starting from January 1948, when the U.S. first began recording the figure, all the way up to October 2015. The x-axis covers the period of 1948-2015 and features twelve blocks representing one month's unemployment rate for each month. Each block height represents the corresponding monthly rate. You can observe a steep drop start to appear in the fall of 2008 as the global economic downturn began unfolding its devastating path. Notably, an impressive comeback occurs through the end of 2015, where joblessness consistently decreases, highlighting an unwavering commitment to growth. Source: U.S. Bureau of Labor Statistics - data available at http://data.bls.gov/timeseries/LNS14000000\nInspired by a unique and visually captivating 2D heat map located here: http://graphics.wsj.com/job-market-tracker/\nAll data used and OpenSCAD files employed in creation are sourced from this fantastic GitHub repository: https://github.com/jonkeegan/us_unemployment_3d_chart\n \n \n Creating Instructions\nThis was engineered within about two hours using the OpenSCAD system, powered by employment data sourced from http://data.bls.gov/timeseries/LNS14000000
With this file you will be able to print U.S. Unemployment Rate 1948-2015 (monthly) with your 3D printer. Click on the button and save the file on your computer to work, edit or customize your design. You can also find more 3D designs for printers on U.S. Unemployment Rate 1948-2015 (monthly).
