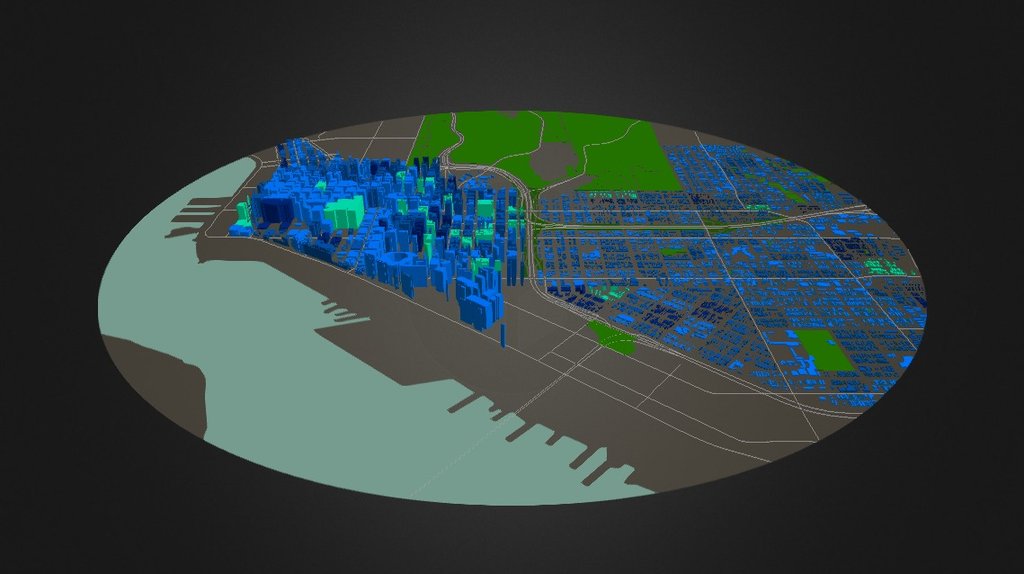
SR 94 Park Cap Study - 2030 Population
sketchfab
Building heights show the maximum allowable height of buildings (as stated by San Diego's Municipal Code Zoning). Building colors reveal the projected population residing within each building, using data from the U.S. Census MGRAs. Lighter-blue buildings represent areas with fewer residents, while darker-blue buildings indicate higher populations. Buildings colored turquoise signify the largest number of residents, exceeding 750 people per U.S. Census MGRA area.
With this file you will be able to print SR 94 Park Cap Study - 2030 Population with your 3D printer. Click on the button and save the file on your computer to work, edit or customize your design. You can also find more 3D designs for printers on SR 94 Park Cap Study - 2030 Population.
