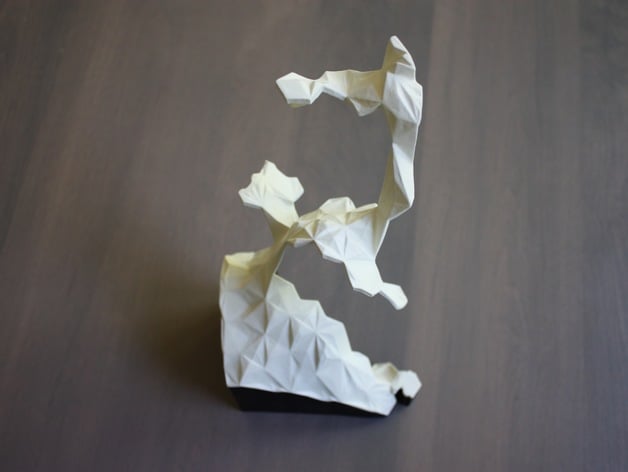
Sculpture of San Francisco Housing Prices
thingiverse
This data sculpture displays a map of housing prices in San Francisco. It's a map of the city, ripped apart by economic disparities. The height of each area represents the average price per square foot for recent home sales. Where neighboring areas share similar values, they're connected, but if they're too far off, I allow them to split, tearing the city along its most severe economic divides. Two model files are included: one is the main sculpture, printed and painted white, and the second is a stand for the sculpture, printed and painted black. For the full writeup: http://dougmccune.com/blog/2016/07/21/sculpture-of-housing-prices-tearing-san-francisco-apart/ Print Settings Printer Brand: Type A Machines Printer: 2014 Series 1 Rafts: Doesn't Matter Supports: Yes Resolution: .15mm Infill: 20% Notes: Printing of the main sculpture took approximately 36 hours. I used Cura for slicing. Post-Printing The print was sanded and finished with a few coats of XTC-3D. Then primed with Montana Gold primer spray paint, then painted with Montana Gold Shock White, and finally sealed with Montana Varnish. A lot of sanding occurred between each step/coat. How I Designed This Data from Redfin The data consists of records of approximately 5,000 recent home sales, downloaded from Redfin. The dataset itself can be downloaded here. The map below shows each sale color-coded by the price per square foot. Hexagon binning I binned the data into hexagons and calculated the average price per square foot for each region. The map below shows these hexagons colored by and labeled with the price per square foot values for each region. You can start seeing the various relative differences between areas of the city. The lowest prices are in Bayview/Hunters Point in the southeast quadrant, and then prices increase as you move northwest. As a general trend, things get more expensive as you get closer to the Marina, Embarcadero, and all areas along the northeast. Noe Valley and the areas around Twin Peaks stand out as more expensive than their neighbors. The data was then turned into a 3D model using a modified version of shp2stl. I defined a threshold for how close together neighboring regions need to be to be connected, and any neighboring regions that exceed that delta are allowed to split from each other. This organically produced the spiral pattern through the city.
With this file you will be able to print Sculpture of San Francisco Housing Prices with your 3D printer. Click on the button and save the file on your computer to work, edit or customize your design. You can also find more 3D designs for printers on Sculpture of San Francisco Housing Prices.