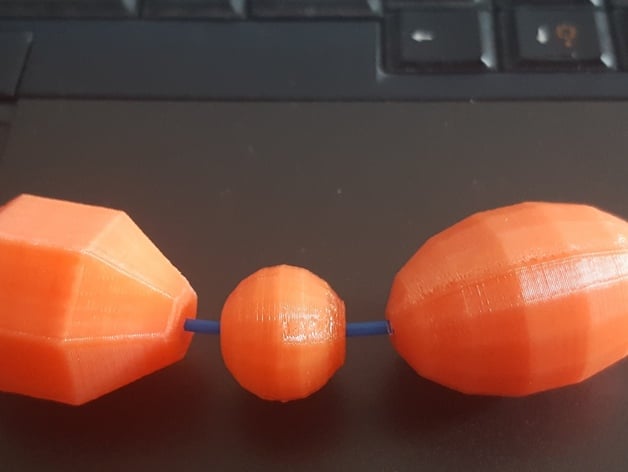
Running activity visualization beads
thingiverse
The purpose of these beads is to visualize your running or walking activity, showcasing three key parameters: running or walking duration, running or walking distance, and average speed. For each run/walk, you can print a parametrized bead that represents these statistics in a unique way. Here's how it works: * Running or walking duration is visualized by the diameter of the bead. * Running or walking distance is represented by the length modification of the bead. * Average speed is shown through the resolution of the bead, with higher values indicating faster speeds. You can use the easy-to-use Customizer (found in the "Apps" section) to create beads that visualize your own running activity. Alternatively, you can download the OpenScad code and modify it to suit your needs. One idea for using these beads is to create a string of pearls that you can proudly wear as a reminder to stay active. Imagine a deal with your partner where each achieved run or walk earns you a silver-plated bead. The bigger, longer, and smoother the beads are, the better you're doing. This design was inspired by Stusak et al.'s research on activity sculptures and their impact on running activity (Stusak, S., Tabard, A., Sauka, F., Khot, R. A., & Butz, A. (2014). Activity sculptures: Exploring the impact of physical visualizations on running activity. IEEE transactions on visualization and computer graphics, 20(12), 2201-2210). The OpenScad code provided is a proof of concept, and there's room for improvement to better fit real runner's perceptions. Tweaking the math values used in the design can help achieve more precise visualizations. **Print Settings:** * Printer: Felix Pro1 * Rafts: Yes * Supports: No * Resolution: 0.2mm * Infill: 50% (but can be lower) Some notes on printing: * Some pieces may have strong overhangs and require support. * The beads may not stick to the print bed, so it's recommended to use a raft or some glue. If you plan to wear the necklace, consider using special filaments like PETG, wood, or stone composites. However, these materials require higher resolutions, so you may need to make the beads bigger. **Post-Printing:** * Filing: Short distance beads may need filing to achieve a smooth finish. * SkewFactor = log(RunningDistance+9) can help create more elongated beads. This design was created through trial and error. The original article suggests a more precise visualization method using edge counting, but the math skills required for polyhedron programming are beyond my capabilities. **Tweaking:** * The diameter of each bead represents the time spent running or walking. * Adding distance will make the bead longer and smoother. * A round bead is achieved when you run or walk 10km. The design uses log10 to compute the diameter and extralength, while AverageSpeed = RunningDistance / RunningDuration \* 60 calculates average speed. SkewFactor = log(RunningDistance) visualizes running distance. **Updates:** * July 8 2016, 15:30- OpenScad file updated with parameter infos and a picture of the first print. * July 8 2016, 22:30 CET- Added more information and a picture with bigger beads. **Future Ideas:** * A commercial idea is to couple this design with fitness tracking services like Fitbit or Garmin. If a person walks over 10km a day, the service can automatically send them a bead visualizing their exploit (fast delivery if possible).
With this file you will be able to print Running activity visualization beads with your 3D printer. Click on the button and save the file on your computer to work, edit or customize your design. You can also find more 3D designs for printers on Running activity visualization beads.
