Population Pyramid
sketchfab
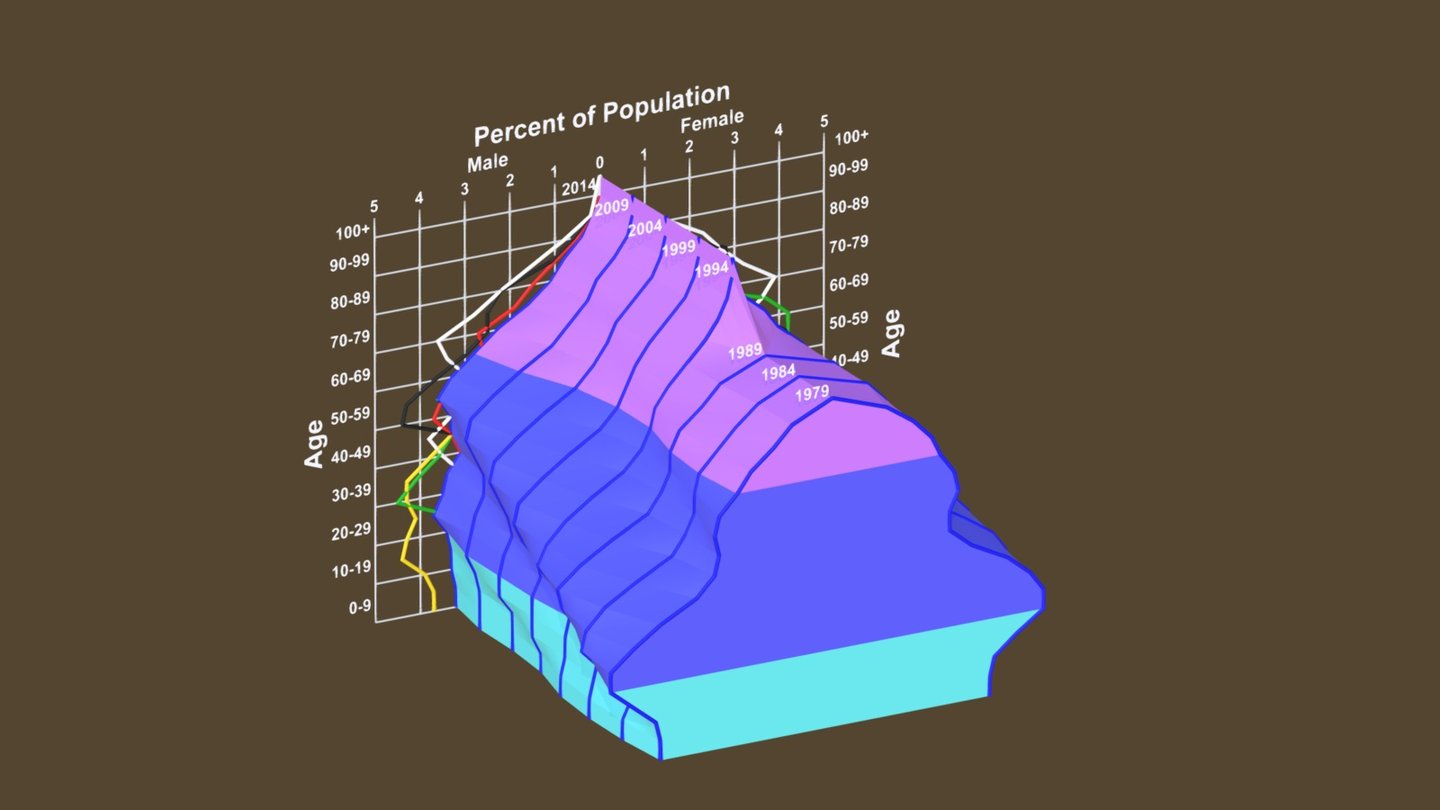
This model displays the US population pyramid spanning from 1979-2014. The 2014 population pyramids of Russia, Brazil, Japan, UK, and Germany are highlighted in their respective colors for that year. A population pyramid reveals what percentage of the overall population falls within each age range. The teal section represents the population between 0-20 years old, while the purple section marks the 65+ age group. Notably: The most striking feature of this model is the aging of the Baby Boomers who entered the workforce before 1979 and began retiring in 2014. Additionally, advancements in medical technology are evident, enabling the growth of the 80+ age range starting in 1989. Internationally, a similar boom to the US Baby Boom can be observed in every country except Brazil. Furthermore, despite the Baby Boom, the US boasts the most stable population pyramid in 2014 after Brazil.
With this file you will be able to print Population Pyramid with your 3D printer. Click on the button and save the file on your computer to work, edit or customize your design. You can also find more 3D designs for printers on Population Pyramid.
