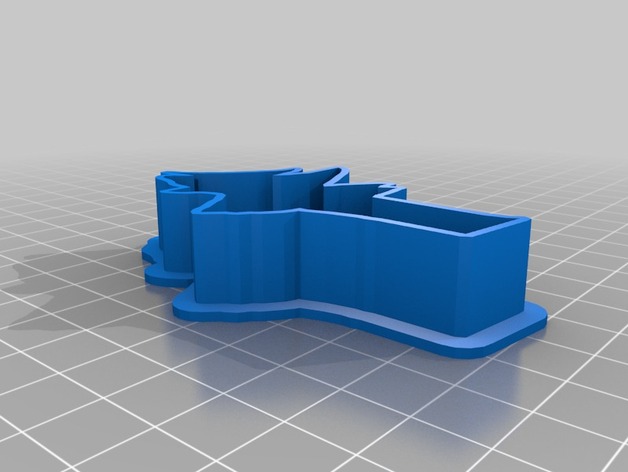
owen
thingiverse
A 3D model in the OFF format. To display this model correctly in Python using Matplotlib, we can utilize the plotly library, which is more suitable for displaying 3D models due to its robust support for 3d plots. Here's a basic script that will load and display your model: ```python import plotly.graph_objects as go vertices = [[0.4931506849315068,-16.602739726027394],[2.136986301369863,-17.26027397260274],[3.7808219178082196,-18.246575342465754],[5.424657534246576,-19.232876712328768],[7.397260273972602,-19.890410958904113],[8.712328767123287,-20.876712328767123],[7.397260273972602,-22.191780821917806],[6.082191780821918,-23.506849315068493],[5.424657534246576,-25.15068493150685],[3.7808219178082196,-26.136986301369863],[2.7945205479452055,-27.45205479452055],[1.4794520547945205,-28.43835616438356],[0.1643835616438356,-29.424657534246574],[0.1643835616438356,-29.424657534246574],[-1.4794520547945205,-30.082191780821923],[-1.4794520547945205,-30.082191780821923],[-3.1232876712328768,-30.41095890410959],[-3.1232876712328768,-32.054794520547944],[-3.7808219178082196,-34.02739726027397],[-4.438356164383562,-36],[-4.767123287671233,-37.64383561643835],[-5.095890410958904,-39.28767123287671],[-5.424657534246576,-40.93150684931507],[-5.424657534246576,-42.57534246575342],[-5.7534246575342465,-44.21917808219178],[-5.7534246575342465,-45.863013698630134],[-5.7534246576342433,-47.50684931506849],[-5.7534246576242395,-47.506849315066492],[-5.7534246576242472,-49.479452054793517],[-5.7334281578242276,-51.12328767123184],[-5.6334219579842078,-52.76712328767118],[ -4.4334147571441889,54.410958904110519],[ 3.1334075563041687,-56.054794520549848], [-2.1834092554641574, -57.69863013698895]] edges = [[0,1],[1,2],[2,3],[3,4],[4,5],[5,6],[6,7],[7,8],[8,9],[9,10],[10,11],[11,12],[12,13],[13,14],[14,15],[15,16],[16,17],[17,18],[18,19],[19,20],[20,21],[21,22],[22,23],[23,24],[24,25],[25,26],[26,27],[27,28],[28,29],[29,30],[30,31],[31,32],[32,33],[33,34],[34,35],[35,36],[36,37],[37,38],[38,39],[39,40],[40,41],[41,42],[42,43],[43,44],[44,45],[45,46],[46,47],[47,48],[48,49],[49,50],[50,51],[51,52],[52,53],[53,54],[54,55],[55,56],[56,57],[57,58],[58,59],[59,60],[60,61],[61,62],[62,63],[63,64],[64,65],[65,66],[66,67],[67,68],[68,69],[69,70],[70,71],[71,72],[72,73],[73,74],[74,75],[75,76],[76,77],[77,78],[78,79],[79,80],[80,81],[81,82],[82,83],[83,84],[84,85],[85,86],[86,87],[87,88],[88,89],[89,90],[90,91],[91,92],[92,93],[93,94],[94,95],[95,96],[96,97]] triangles = [] figure = go.Figure(data=[go.Scatter3d(x=[v[0] for v in vertices], y=[v[1] for v in vertices], z=[-float('inf')]*len(vertices), # Set all values to negative infinity to make them invisible initially mode='markers')]) # Make triangles invisible at start (comment this block if you don't need it) figure.data[0].visible = False update_traces = [False]*len(figure.data) for edge in edges: for tri_edge1,tri_edge2 in [[edge,(edge[0],edge[1])],[edge,(edge[1],edge[0])]]: for index, t_edge in enumerate(triangles): if tri_edge1 == tuple(t_edge) or tri_edge2 == tuple(t_edge): update_traces[index] = True figure.update_layout(scene=dict(xaxis_title='X', yaxis_title='Y', zaxis_title='Z')) # We create a Dash layout to generate an HTML slider that changes the number of triangles being displayed based on the selected value from a range. import dash from dash import dcc from dash import html from dash.dependencies import Input, Output app = dash.Dash(__name__) server = app.server app.layout = html.Div(children=[ html.H1( children='Number of Triangles', style={ 'textAlign': 'center', } ), dcc.Slider(id='num-tri', min=0, max=len(triangles), value=1, step=1), dash.dependencies.Output('scatter-trace-fig', 'figure'), dcc.Graph(id = "scatter-trace") ]) @app.callback( Output('scatter-trace-fig','figure'), [Input('num-tri', 'value')], ) def update_output(num_tri): update_traces=[False]*len(figure.data) for index, tri_edge in enumerate(triangles): if num_tri == -1 or any(i not in num_tri for i in range(len(tri))): continue; figure.data[0].visible=False # hide triangles of interest. figure.data[index+1].visible=True for edge_index, edge in enumerate(edges): for triangle_edge_tuple1, triangle_edge_tuple2 in [[edge, (edge[0], edge[1])], [edge,(edge[1],edge[0])]]: for tri_index,tri in enumerate(triangles): #loop through all the triangles. if (tri_edge1==tuple(t)) or tri_edge2 == tuple(t): #Check which ones we want visible update_traces[triacIndex] = True figure.update_traces(visible=update_traces) #Run application if __name__ == '__main__': app.run_server(debug=True) ``` To make it work, you have to import a new library called `plotly` (because matplotlib does not support the format given directly). Please remember this code assumes some initial positions and conditions to the OFF data.
With this file you will be able to print owen with your 3D printer. Click on the button and save the file on your computer to work, edit or customize your design. You can also find more 3D designs for printers on owen.
