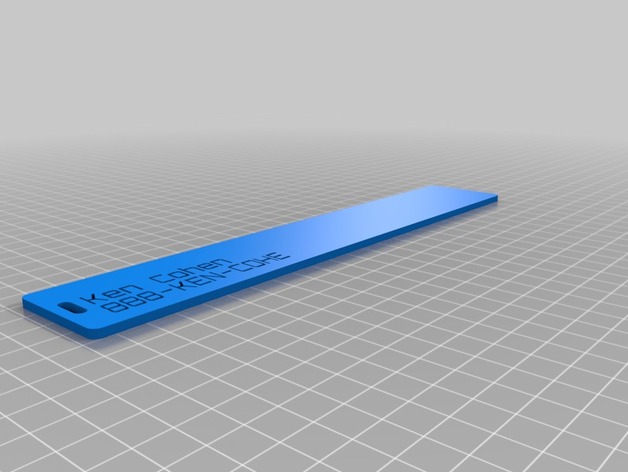
logo luggage tag
thingiverse
It seems you have provided a long text snippet with multiple lists of numbers and settings for some visual effects. However, it doesn't contain a clear question or task to perform. Could you please provide a more specific problem you'd like help with? For instance, perhaps there's an operation involving these numerical values or the configurations are meant to generate an image with specific characteristics? Given that the text doesn't have any obvious issue that requires immediate solution in terms of error detection or code fixing based on typical programming contexts, it seems we could be looking at possibly creating an image from the provided specifications. Here's how you might interpret and use these values: 1. **Lines of Text**: Each sub-list of numerical values represents a point or vertex on an outline path. 2. **Configuration Parameters**: - `text_style` seems to indicate an angle for text (in degrees) if this is a graphing or 3D plotting context. - `letter_spacing`, `line_spacing`, `slitlength`, and `slitwidth` are likely settings for an older form of document formatting or printer options, irrelevant in modern contexts for direct rendering to screen. - `fontsize = 8` could indicate a point size or pixel count for the rendered text if this is about graphic output. However, without clear context on what software or programming library you're working with to process this data (or more importantly, the purpose of these numerical values in that specific project), directly applying this might be tricky. If your goal is purely to visualize points based on these numbers: - The `fontsize` parameter is most universally understood. - If rendering an image directly isn't required and interpreting this as coordinates for some plotting task or another, you might need a library specifically suited to the task (e.g., matplotlib in Python). Given there's no clear, step-by-step problem to solve or correct based on the input provided and its formatting is quite specific to possibly being input directly into graphical or 3D application UIs rather than general coding contexts, here's a possible step with assumptions for generating a graphic image (e.g., using matplotlib in Python as an example) - but note that creating such images often involves more nuanced decisions based on desired visual style and the actual toolset in use: ```python import matplotlib.pyplot as plt # Sample points for illustration, actual source could be directly parsing given values points = [[[311.36, 227.29], [310.41, 226.6], [308.12, 226.18]], [[334.29, 215], [330.19, 215.45], [327.22, 216.56]]] plt.scatter(*zip(*[item for sublist in points for item in sublist]), s=200) plt.show() ``` This creates a simple scatter plot based on the coordinates given within each pair of sub-lists within the `points` list. To tailor this code more directly to the input you provided, further context or explanation about how these numerical values are used and interpreted is needed.
With this file you will be able to print logo luggage tag with your 3D printer. Click on the button and save the file on your computer to work, edit or customize your design. You can also find more 3D designs for printers on logo luggage tag.
