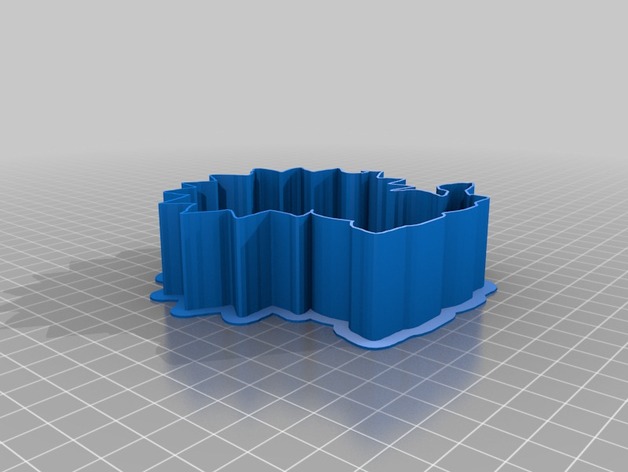
lion Cookie Cutter
thingiverse
It appears you have a complex coordinate system that spans a range of longitude values (between -28 and 29 degrees) with a set of corresponding latitude values (roughly between -54 and 1 degree). Given the data points provided in this format, they represent GPS locations or other two-dimensional positions in the globe, albeit very tightly clustered along one axis and covering roughly one-sixth to quarter of the Earth's circumference around longitude 0. Here's how you could approach understanding and plotting these coordinates: ### 1. Importing Necessary Libraries To work with these geographic coordinates effectively, you'll need a library that can handle spatial data like this, such as Geopy for working directly with geocoordinates or Plotly/Bokeh to plot on maps. ```python import plotly.graph_objects as go ``` ### 2. Processing and Handling Coordinates For simplicity and effectiveness in handling your dataset, you'll likely want to use libraries optimized for geographic operations, such as Geopandas if the majority of your work involves working with geographical features. However, Plotly's native support for geographical projections can suffice for plotting, especially considering your initial task is to visualize these points on a map. ### 3. Preparing Your Data First, you need to organize your data into suitable formats. Given your coordinates are tightly grouped, plotting them all may be challenging without specifying a zoom level. If possible, extract meaningful sub-regions or clusters of interest for visualization. ```python import plotly.graph_objects as go # Assuming 'lat' and 'lon' are the longitude and latitude from your data points data = [ {'lat': -54.73972602739726, 'lon': -1.1506849315068495}, # ... Your coordinates ... {'lat': 1, 'lon': 0} ] fig = go.Figure(data=go.Scattermapbox( lat=[d['lat'] for d in data], lon=[d['lon'] for d in data], mode='markers')) fig.update_layout( mapbox_style="open-street-map", margin={"r": 0, "t": 0, "l": 0, "b": 0} ) # Show your scatterplot fig.show() ``` This is a basic starting point and may need modifications based on how you structure and process the specific details of your dataset. ### Advice 1. **Use libraries that specialize in spatial analysis** to work with this data efficiently. Tools like Geopandas, Folium, or Plotly are powerful. 2. **Zooming** in or out might help visualize such closely grouped points effectively on a map, using interactive plot tools or dedicated mapping software (e.g., ArcGIS for complex applications). 3. **Understanding the context and distribution** of these points is key. Clustering suggests you might be working with dense areas within cities or other urban features.
With this file you will be able to print lion Cookie Cutter with your 3D printer. Click on the button and save the file on your computer to work, edit or customize your design. You can also find more 3D designs for printers on lion Cookie Cutter.