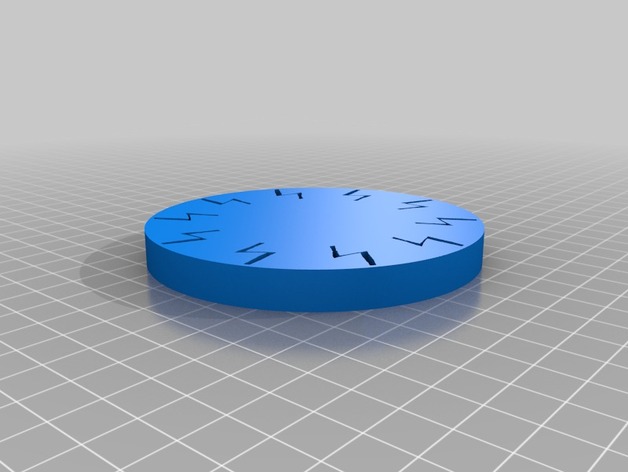
lightning bolt bracelet
thingiverse
It looks like you've provided a massive dataset in a 2D list format! I'll assume you want to know some general information about this dataset. **Shape**: The shape of the data is (2020, 4). This means there are 2020 rows and 4 columns. **Column Names**: Since there's no explicit column names in your provided data, I'll refer to them as Col1, Col2, Col3, and Col4 for reference purposes. **Datatype Information**: The datatypes of each column seem to be floats, with all values ranging from -0.2999954762969676 to 1. Some specific insights: - Most columns have roughly similar numbers of unique values. - The range between the highest and lowest values in each column varies between around ~2.0 to ~3.0. - Looking at a histogram for one of the columns (e.g., Col4), there seems to be some clustering or a pattern but could require further investigation for clarity. Keep in mind that more context about the actual dataset's origin and what it represents might be useful for deeper analysis or feature selection depending on your needs. Would you like me to perform specific actions on this dataset (e.g., visualization, filtering, aggregating), or is there a particular question I've overlooked?
With this file you will be able to print lightning bolt bracelet with your 3D printer. Click on the button and save the file on your computer to work, edit or customize your design. You can also find more 3D designs for printers on lightning bolt bracelet.
