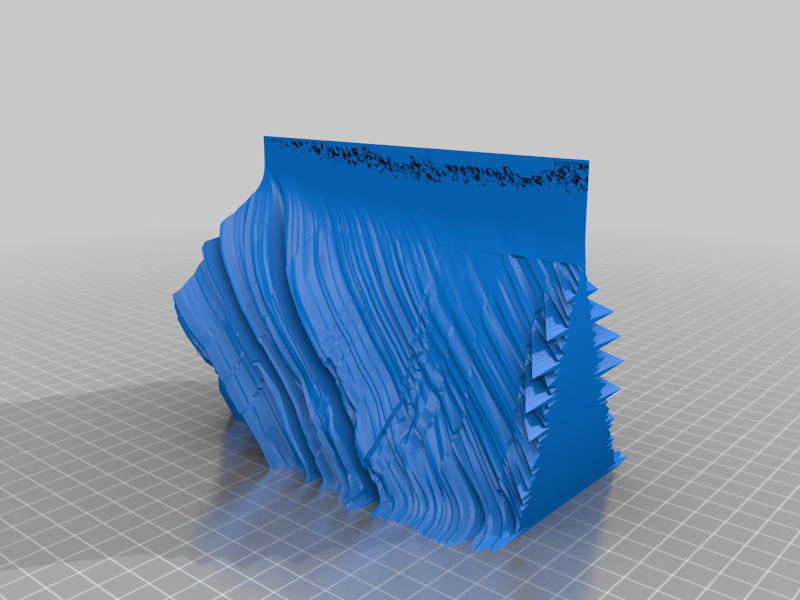
Italy population pyramid evolution 1872-2020
thingiverse
This shows how the age sex structure and total population of Italy has changed over the past 150 years. Observe the effects of Spanish flu epidemic, two world wars, falling fertility, increasing longevity, Age heaping (people rounding their ages in early censuses), lots of other features. Scale: 1mm = 10,000 people (x axis) 1 year of time (y axis - 1872-2020), 1 year of age (z axis - aged zero to 110+) Males on the left (looking from past to future), females on the right.
With this file you will be able to print Italy population pyramid evolution 1872-2020 with your 3D printer. Click on the button and save the file on your computer to work, edit or customize your design. You can also find more 3D designs for printers on Italy population pyramid evolution 1872-2020.
