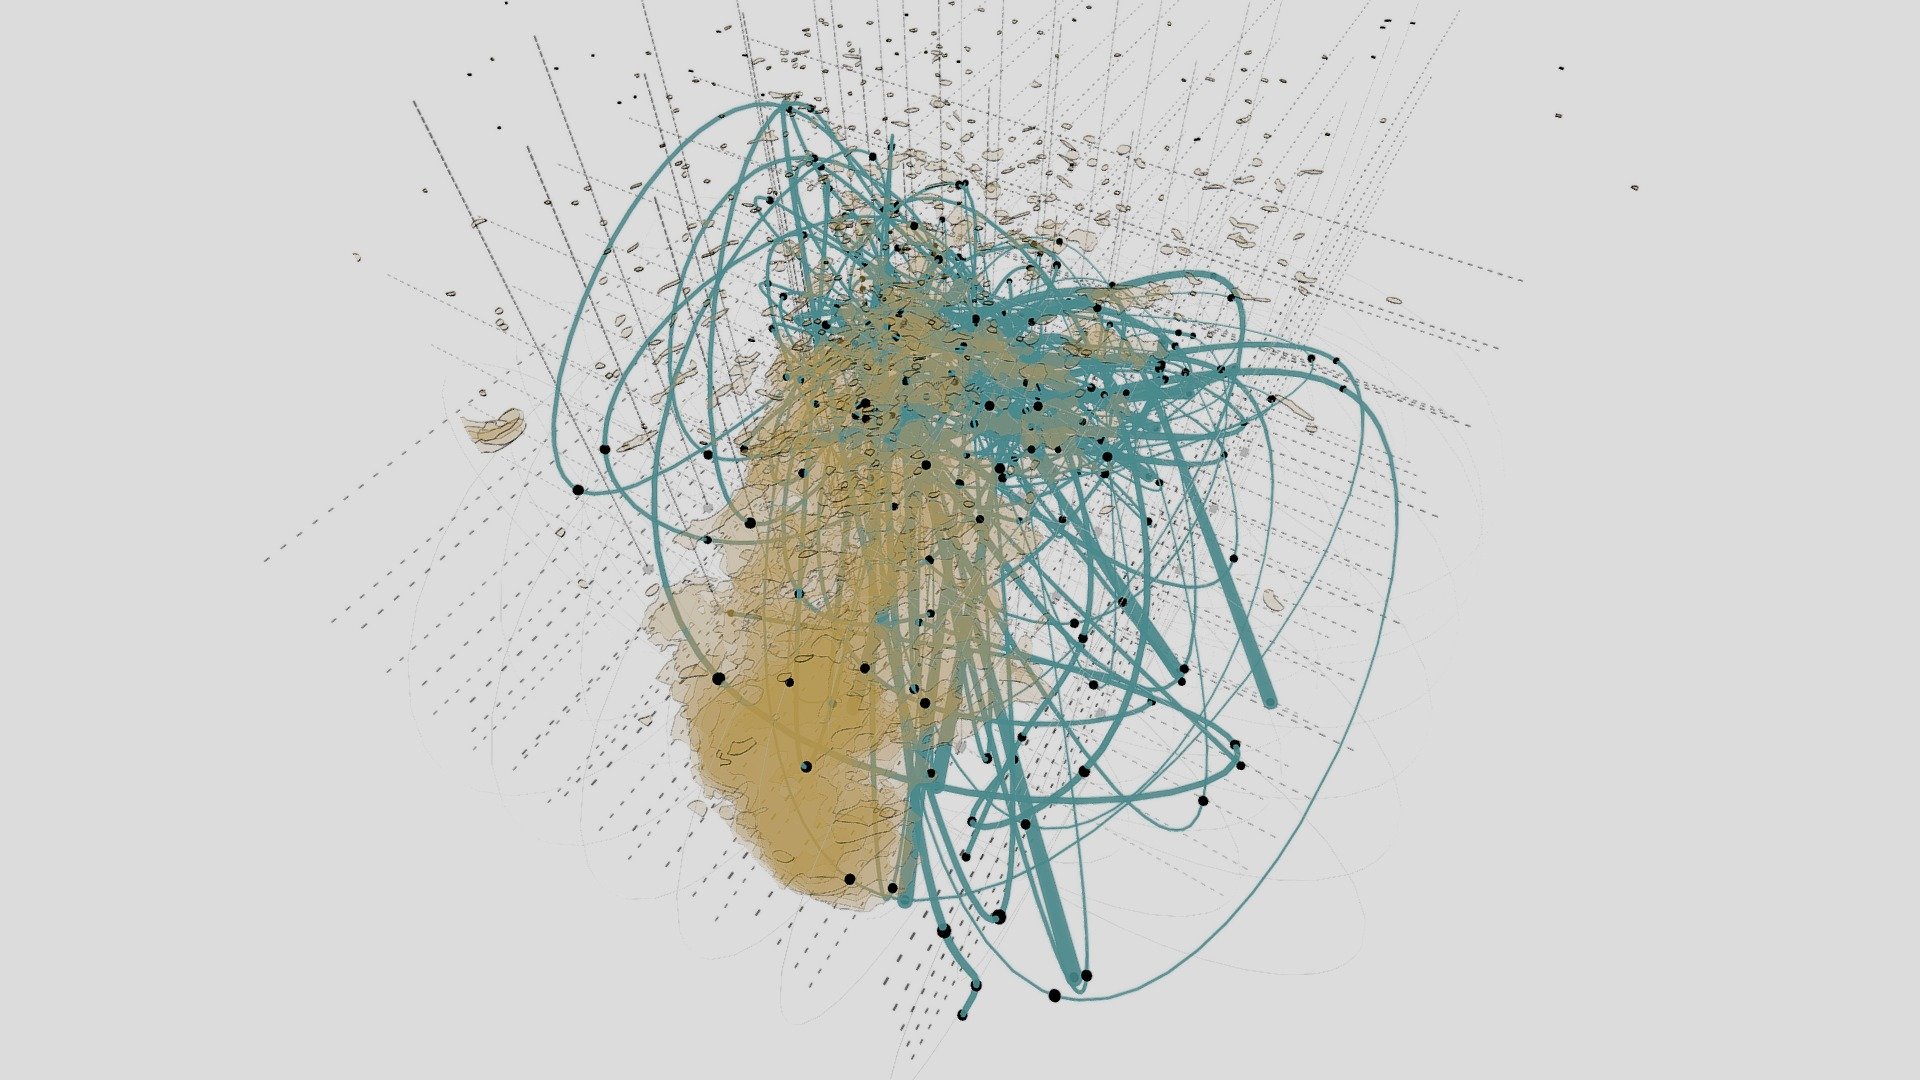
Hudson River Flow/Erosion Data Visualization
sketchfab
Data visualization comes alive in this immersive VR drawing, where rotating environments overlap transparent trajectories to illustrate overall movements and trends in real-time. A dynamic system of constrained points is strategically placed within the Hudson River, capturing every movement and tracking each trajectory. This snapshot-in-time reveals the forces at play as flows converge and diverge across the field, creating a vivid display of energy in motion.
With this file you will be able to print Hudson River Flow/Erosion Data Visualization with your 3D printer. Click on the button and save the file on your computer to work, edit or customize your design. You can also find more 3D designs for printers on Hudson River Flow/Erosion Data Visualization.
