Graphs, The Traveling Salesman Problem, and P vs NP
thingiverse
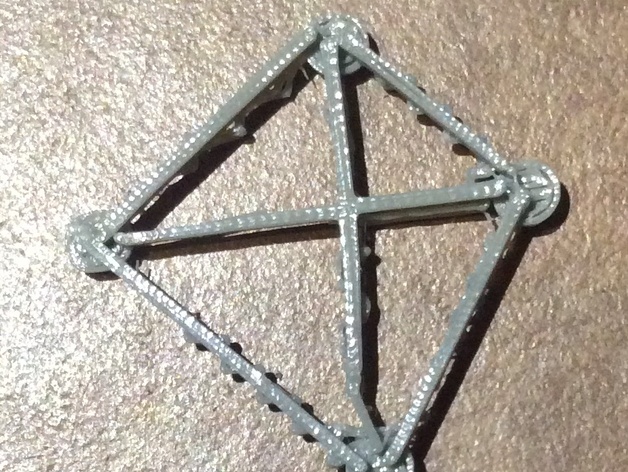
This activity is designed for a computer science class or a discrete math class when students first learn about graphs and efficiency of algorithms. It can also be used as an enrichment activity for high school students since it is self-contained with all definitions given and there isn't any specific background knowledge needed. Printer Settings Printer Brand: MakerBot Printer: MakerBot Replicator Rafts: Yes Supports: Yes Resolution: standard Infill: 10% How I Designed This I created a graph using circles and polyline for lines in 123D Design. I used the measure tool to get all the lengths. If you want students to be able to print their graphs, you'll need to use an object instead of just a line to be able to extrude the graph. I used polyline to create rectangles. My graph took 6 minutes to print, but it's fragile. You could scale it up. I chose not to so that it would print with the same dimensions I measured for the project. Overview and Background Students get an introduction to graphs using the Kevin Bacon Game. Then they learn some vocabulary terms, including Hamiltonian circuit. Students use 123D Design to create graphs. This leads to an introduction to The Traveling Salesman Problem. From there, they look at the efficiency of algorithms and P vs NP. Objectives Students will learn definitions and get practice for the following terms: Graphs, Hamiltonian circuit, The Traveling Salesman Problem, and algorithm efficiency. Skills Learned (Standards) Students learn what a graph is, how to recognize and create a Hamiltonian circuit, how to solve The Traveling Salesman Problem, and get an introduction to algorithm efficiency. Lesson Plan and Activity Further detail is provided in the student and teacher worksheets. To introduce what graphs are, go to https://oracleofbacon.org. Ask students for actor names to get a few connections and start drawing a graph on the board. Make the actors vertices and movies they were in together edges. Then explain that graphs are made up of edges (lines) and vertices (dots). Show a clip from Good Will Hunting that has an example of a graph: https://www.youtube.com/watch?v=Bylkoiyz7Ww Define a walk, a circuit, and a Hamiltonian circuit. In groups, students create a graph with a Hamiltonian circuit using 123D Design and measure the length of each edge. Then they trade with another group to locate the circuit. Introduce The Traveling Salesman Problem and students use their graph to go through an example. Students think about how many possibilities they have to check for a route with n cities. Show a factorial, exponential, and polynomial graphed on the same set of axes to show that the polynomial function grows much slower than the other two. Go through an example that is solved in polynomial time. Explain P vs NP. Show clips from Elementary that go into P vs NP in further detail. Duration of Lesson 1-2 days Preparation No specific background knowledge is needed. Rubric and Assessment Here is a sample rubric to use with the worksheet: Question (points) 1 (2) 2 (6) 3 (4) 4 (2) 5 (8) 6 (1) 7 (2) Total (25) References All the definitions and background you need is included in this activity.
With this file you will be able to print Graphs, The Traveling Salesman Problem, and P vs NP with your 3D printer. Click on the button and save the file on your computer to work, edit or customize your design. You can also find more 3D designs for printers on Graphs, The Traveling Salesman Problem, and P vs NP.
