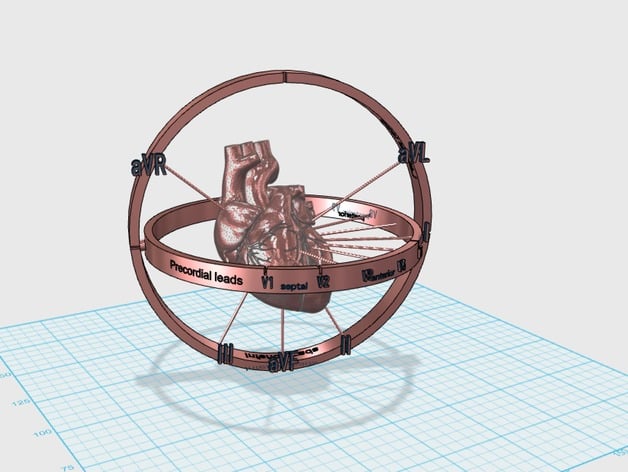
ECG 3D Visualizer
thingiverse
UPDATE 1 A new, improved model has been created with reinforced features to make it easier to print. I have updated the design, strengthening certain parts to ensure that it can withstand the printing process better. You can find the revised version under the downloads tab - it's called "even more robust visualizer". Objective: To create a visual representation of the heart regions from which the bioelectrical signal (wave of depolarisation) is originating and use this information to enhance ECG readout interpretation. Target audience: Medical students, AP biology students, anyone interested in understanding the source of ECG signals. Prerequisites: A basic grasp of heart anatomy and its electrical conduction system. Procedure: Simply print the model and observe. Outcome: This visual aid is intended for use during introductory ECG interpretation sessions. The next step would be to analyze a genuine ECG trace to determine the electrical axis, serving as an assessment of comprehension. As part of my medical training, I'm required to master Electrocardiogram (ECG) analysis. This fundamental skill is essential for diagnosing heart conditions and pinpointing the source of an ECG signal can make all the difference between life and death. Unfortunately, current teaching methods are woefully inadequate, relying on static images and simplistic explanations that fail to engage medical students. Online resources abound, but finding a reliable tutorial amidst the noise is a daunting task. An ECG provides a graphical representation of heart electrical activity. The signal patterns in an ECG can be decoded to diagnose cardiac conditions, making it an indispensable tool for medical professionals. The problem lies in visualizing the heart's electrical pathways and understanding which leads are detecting the signals. This 2D representation fails to convey the intricate relationships between the electrodes, leads, and the anatomy of the heart. Standard textbooks present generic diagrams showing a frontal view of the chest, offering little insight into the complex processes occurring within the heart. Youtube tutorials abound, but most lack substance or practical application. To fill this knowledge gap, I created 3D models to help medical students visualize the heart's electrical activity and connect it to real-life ECG signals. The "heart with leads" design centers around a beautifully rendered heart, originally designed by Mvetto, modified by huntgatherer98. While its primary purpose is to serve as a model of heart anatomy, my design takes it further, mapping the electrodes to their respective locations on the heart. To refine this design and make it more accurate, I plan to integrate feedback from fellow medical students and designers. The keychain "mean electrical axis" model uses the standard ECG leads (aVR, aVL, aVF) to visualize the relationship between lead orientation and wave direction. If the trace shows an inverted wave for any of these leads, it means the signal is moving in the opposite direction; if the wave appears biphasic, the signal is travelling perpendicular. Please share your thoughts on how to improve this design and contribute to its evolution. I'll ensure that all modifications are accurately documented for future reference. Printer settings: daVinci 1.0AiO Rafts: No Supports: Yes Resolution: 0.1 Infill: 20% Still experimenting with these settings to achieve the perfect balance between model stability and filament efficiency. Project information: Objective: Visualizing the heart regions that generate the bioelectrical signal (wave of depolarisation) to enhance ECG interpretation skills. Audience: Medical students, AP biology students, anyone seeking to understand the origin of ECG signals. Prerequisites: Basic knowledge of heart anatomy and its electrical conduction system. Steps: Simply print the model and observe the results. Outcome: This tool is intended for use in introductory ECG sessions. The next step would be to analyze a genuine ECG trace and determine the electrical axis, serving as an assessment of comprehension.
With this file you will be able to print ECG 3D Visualizer with your 3D printer. Click on the button and save the file on your computer to work, edit or customize your design. You can also find more 3D designs for printers on ECG 3D Visualizer.
