Climate Graph
thingiverse
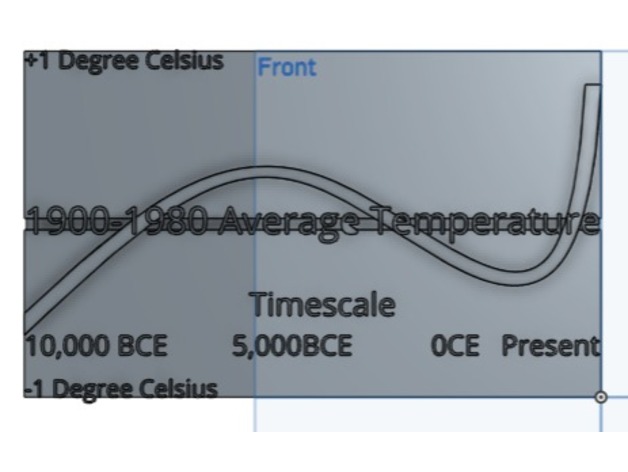
This is a pretty rough graph showing global average temperatures over the past 10,000 years compared to the 1900-1980 average. My data comes from a quick Google image search and xkcd.com/1732. If someone tries to tell you "The Earth's temperature has changed before," show them this web comic and say, after setting your car on fire, "Your car's temperature has changed before."
Download Model from thingiverse
With this file you will be able to print Climate Graph with your 3D printer. Click on the button and save the file on your computer to work, edit or customize your design. You can also find more 3D designs for printers on Climate Graph.