 Thingiverse
Chart of nuclides showing Mass excess (~Binding energy) per nucleon
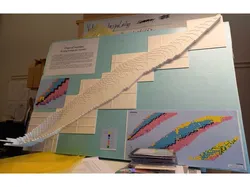
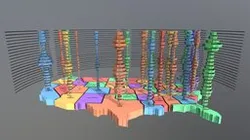
The chart of nuclides is a two-dimensional graph of isotopes of the elements, in which one axis represents the number of neutrons (symbol N) and the other represents the number of protons (atomic number, symbol Z) in the atomic nucleus. Each point thus represents a nuclide of a known or hypothetical chemical element. This system of ordering nuclides can offer a greater insight into the characteristics of isotopes than the better-known periodic table, which shows only elements and not their isotopes.In this 3D version, the height represents the mass excess (~binding energy) per nucleon, i.e. the lower the more stable. The most stable isotopes are thus more stable than their neighbours, which may decay to the more stable nuclide.The depression in the centre is called the “Valley of Stability” where we find stable nuclides. Fusion of lighter nuclides moves the product upwards towards the minimum, while fission of heavy nuclides moves the products downwards towards the minimum.The chart is quite large so I had to divide it into nine separate parts.I glued the parts on a styrofoam board for easy handling.Use the picture and lines indicating "Magical Numbers" to align the different parts.
Direct link to the original creator's page
More from Persson_jr

Similar Models
 Cults3D
 Sketchfab
 NIH 3D
 Thingiverse
 Thingiverse
 CGTrader
 GrabCAD
 Thingiverse
Model Specifications
Frequently Asked Questions
How do I download Chart of nuclides showing Mass excess (~Binding...?
Click the "View on Thingiverse" button above to visit the original model page on Thingiverse. You can download the STL file directly from the creator's page for free.
What 3D printer can I use for this model?
This model is compatible with most FDM 3D printers (Creality Ender 3, Prusa MK3S+, Bambu Lab, etc.) and resin printers (Elegoo, Anycubic). Check the original page for recommended print settings and materials.
Is this 3D model free to download?
Yes, this model is available as a free download on Thingiverse. Some creators accept tips or donations.
Can I modify this file?
Check the license (see original page) on the original Thingiverse page. Most STL files can be modified using free software like Blender, TinkerCAD, or Meshmixer.