Binghamton Election District Maps
thingiverse
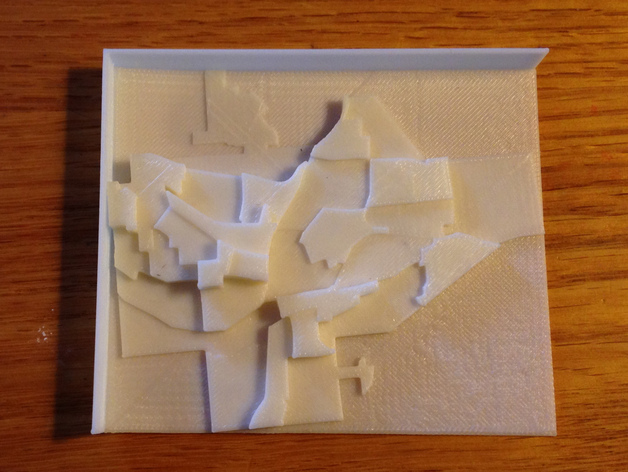
Prism maps reveal Binghamton's election district population density and voter turnout, with data from Broome County GIS Portal and 2013 mayoral election results. The top and bottom prisms represent upper and lower bounds of the data from .scad scripts. Population density scale ranges from 0 to 5000 people per sq km; voter turnout ratio, 0 to 1. Binghamton's election district shapefile attributes include 2010 census population counts. Vote counts and population densities are calculated using specified methods. OpenSCAD scripts enable customizable maps via Thingiverse Customizer or creation of your own study area prism maps with Prismap tool. Print instructions provided for 3D model.
With this file you will be able to print Binghamton Election District Maps with your 3D printer. Click on the button and save the file on your computer to work, edit or customize your design. You can also find more 3D designs for printers on Binghamton Election District Maps.