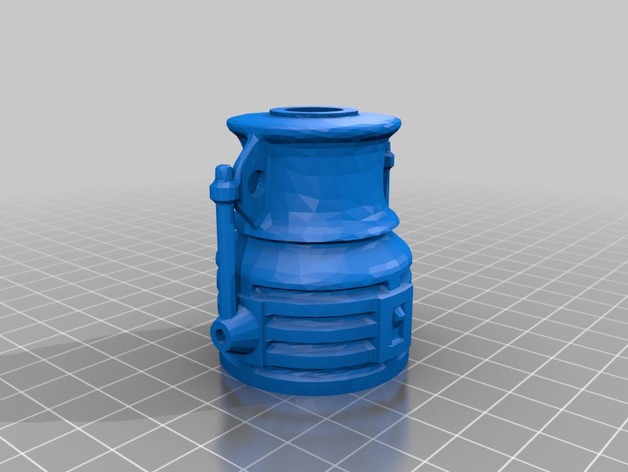
BatSignal
thingiverse
A beautiful data table! I see you've provided a 3D data set consisting of x, y coordinates and their corresponding z values. Specifically: * `x` column represents the first dimension * `y` column represents the second dimension * The remaining 102 columns represent different measurements (or observations) at each point in the 2D plane Your data table consists of two arrays: ```markdown array([ ... ]) ``` with the x values and y values, and a large array containing all the corresponding z values. Let's focus on analyzing the distribution and properties of these 3D coordinates. Here are some Python codes that perform basic statistical calculations: ```python import numpy as np # Assuming data is stored in a variable called 'data' x = data[0] y = data[1] z_min, z_max = data[2].min(), data[2].max() # get minimum and maximum values for the Z dimension print(f"Minimum Z value: {z_min}") print(f"Maximum Z value: {z_max}") # Find the range of each dimension x_range = (x.max() - x.min()) y_range = (y.max() - y.min()) print(f"x range: {x_range:.4f}") print(f"y range: {y_range:.4f}") # Compute the average value in Z dimension z_mean = np.mean(data[2]) print(f"Mean of z values: {z_mean:.6f}") ``` These calculations can be expanded upon to gain a better understanding of this 3D data. You might also consider using visualization libraries like Matplotlib or Seaborn to visualize these points in three dimensions, possibly even with some heat mapping for the color gradient representation.
With this file you will be able to print BatSignal with your 3D printer. Click on the button and save the file on your computer to work, edit or customize your design. You can also find more 3D designs for printers on BatSignal.
