Bathymetric Laser Cut Map of Arabian Sea
thingiverse
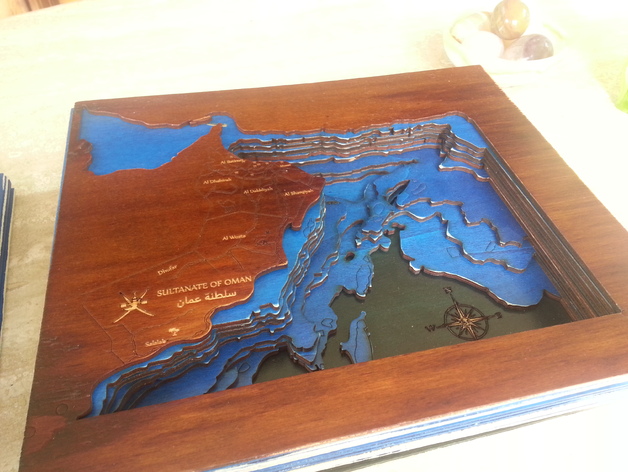
This is an illustrative (topography of the sea) chart of the Arabian Sea, featuring the terrain level and roads of Oman as well as key city names, regions, and some distinctive small pictures representative of the country itself. Take a look for yourself in the images below. Instructions Making this chart was my first attempt at creating one such map, but once I got the hang of it, the process proved relatively simple despite being quite time-consuming. My goal is to produce an even larger map in the near future, although the available resources at Fablab Aachen's disposal – specifically the 300x600mm Lasercutter – may limit its size. The chart utilizes a consistent color scheme for engraving and cutting. To tailor this setup according to your needs, however, individual configuration settings within your lasercutter software will be necessary. I managed to collect the bathymetric data needed for my project by accessing Live Access Servers for NVODS (National Virtual Ocean Data System). Despite it being a relatively difficult process, I eventually figured it out with persistence and practice. To render datasets in Ferret, you need to enter certain parameters through the "Plot Options" interface. During this exercise, I learned that rendering height information based on layers can result in highly detailed visualizations. For this particular task, twelve distinct layers proved ideal for capturing depth nuances accurately within a set resolution. In the field for rendering settings (-3900,2500,500) in the Plot Options section, inputting these coordinates produced exactly what I was looking for – everything below -3900metres rendered as white upon initial setup. After clicking print, you'll be prompted to open the new tab and save the image or discard it, whichever you prefer. In order to proceed further, select each individual render starting from the deepest (-3900) layer all the way up until (-2900), then import these pictures into Illustrator as layers. It is best if every image shares the same dimension to prevent unnecessary scaling during the following vector tracing step. Select 'select', and position them exactly atop one another before converting their respective layers by copying then pasting those with a white fill as a final measure. Your resulting piece should be made ready for cutting, and I took some liberty to embellish my work with engravings – although feel free to customize this detail according to your own artistic expression. I constructed my project from variously colored panels cut out with the assistance of Fablab Aachen's lasercutter capabilities in addition to staining parts differently for visual variety. This, too, is entirely at your discretion depending upon your aesthetic vision for the map and/or chart you plan on creating. I really hope this sparks inspiration within all readers – and best regards as well!
With this file you will be able to print Bathymetric Laser Cut Map of Arabian Sea with your 3D printer. Click on the button and save the file on your computer to work, edit or customize your design. You can also find more 3D designs for printers on Bathymetric Laser Cut Map of Arabian Sea.