20 shades of election
sketchfab
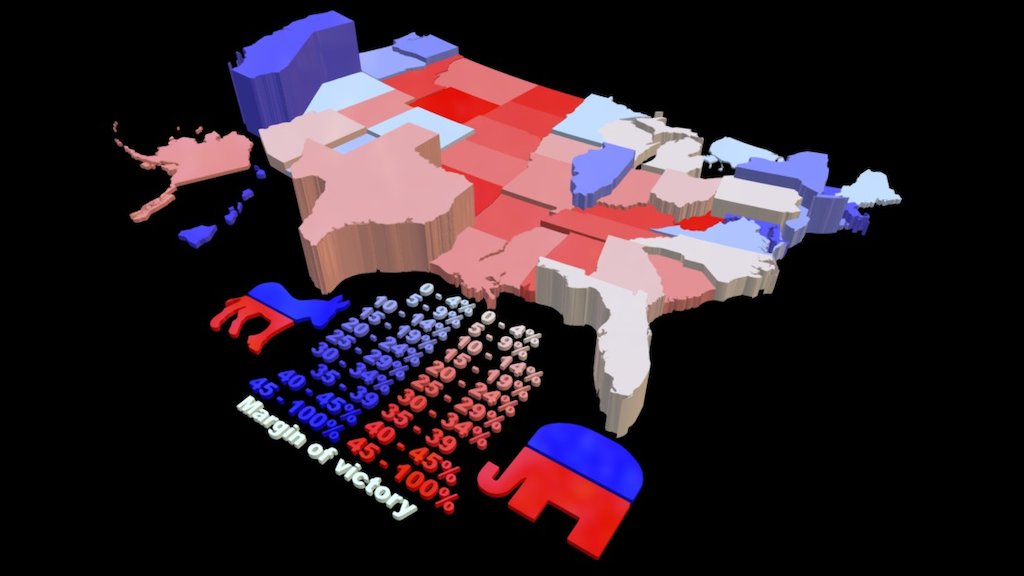
This 3D map represents the results of the 2016 presidential election as of November 9, 2016, at 10:47 am EST, with blue and red shading used to indicate the margin of victory at the state level - see key in the Gulf of Mexico - and height showing the relative number of electoral votes for each state and DC. A small US icon above Ontario is shaded to reflect the national popular vote, which was 59,459,229 Democrats to 59,272,991 Republicans as of 12:04 PM EST, with a 0-4% blue shading. This map does not offer an opinion on the outcome of the 2016 presidential election or the Electoral College; it's simply a map that I wanted to see but couldn't find anywhere else.
With this file you will be able to print 20 shades of election with your 3D printer. Click on the button and save the file on your computer to work, edit or customize your design. You can also find more 3D designs for printers on 20 shades of election.